I was over on the Silicon Labs 8-bit MCU forum, where someone asked about doing EFM8 printf-style debugging using the C2 debugger connection. I actually faced an identical dilemma a few weeks ago while working on a smart water sensor. I didn’t frame the problem in my head the same way the forum post did, because everyone knows it’s impossible to print messages over a SiLabs C2 debugger connection — but naïveté breeds innovation, and this forum post unwittingly inspired a sudden realization that I could get something hacked together to do exactly what was asked: print trace messages over a debugger connection without any sort of UART.
Background
There are two common mechanisms for debugging code on a bare-metal MCU platform: on-chip debugging, and tracing. On-chip debugging (OCD) is a powerful technology that lets your computer control execution of the core, set breakpoints, and read/write registers, memory and flash data. Tracing is much simpler — messages are printed to the computer that tell the developer where the MCU is, and what it is doing. If you’ve used an Arduino before, you are no doubt familiar with tracing, as it’s your only option for finding problems in your code.
While I end up using OCD with almost everything I work on, tracing is extremely useful when you’re interested in studying how your system is behaving in situ; while you can certainly set a breakpoint, wait for the MCU to hit it, and then inspect the value of variables, this will grind the entire platform to a halt, which could have huge ramifications for any time-critical code.
Tracing is traditionally done through a hardware UART on the MCU; a TTL-level USB-to-serial adapter transfers the data to the computer, which displays it on a terminal. But this requires dedicating an entire (and often the only) UART to this purpose. On a small pin-count MCU, it’d be nice if we could print trace messages using the same interface we debug with.
This is not a new idea; in fact, part of the ARM Cortex-M SWD debugging interface specification is SWO — Single-Wire Output — which can be used to print trace messages while the MCU is running. Lower-end ARM cores also have semihosting, which is a similar (but much slower) mechanism.
This project mimics the SWO/semihosting idea, but my implementation targets the EFM8 and newer C8051F MCUs from Silicon Labs, which uses the Silicon Labs C2 interface for debugging. Having said that, it should be extendable to Microchip/Atmel’s debugWIRE and ICD debuggers as well.
Implementation
The overall method can be summarized as:
- Set aside some XRAM at an agreed-upon location.
- The EFM8 writes trace strings into that XRAM using sprintf().
- The EFM8 writes a final byte to the location which contains the number of bytes to read (called the flag).
- The debugger periodically polls the flag until it is non-zero. When it is, it reads that number of bytes, resets flag to zero, formats the data it read as an ASCII string, and displays it.
- The EFM8 waits for the flag to be reset to zero before repeating this process.
To implement this on the host side, I created a WPF application that calls into the slab8051.dll backend used by Simplicity Studio to communicate with C2 debuggers.
Most of the API calls were originally from the SiUtil.dll file mentioned in AN117, which is a publicly-available DLL designed for users to integrate into their own production software. Unfortunately, the DLL hasn’t been updated in quite some time, and Simplicity Studio uses a newer debugger firmware version than the SiUtil.dll file supports. Every time you use SiUtil.dll to connect to a debugger, it will download the old firmware image to the debugger. Simplicity Studio will automatically upgrade it back to the latest version — and these two programs will continue to fight over the adapter forever.
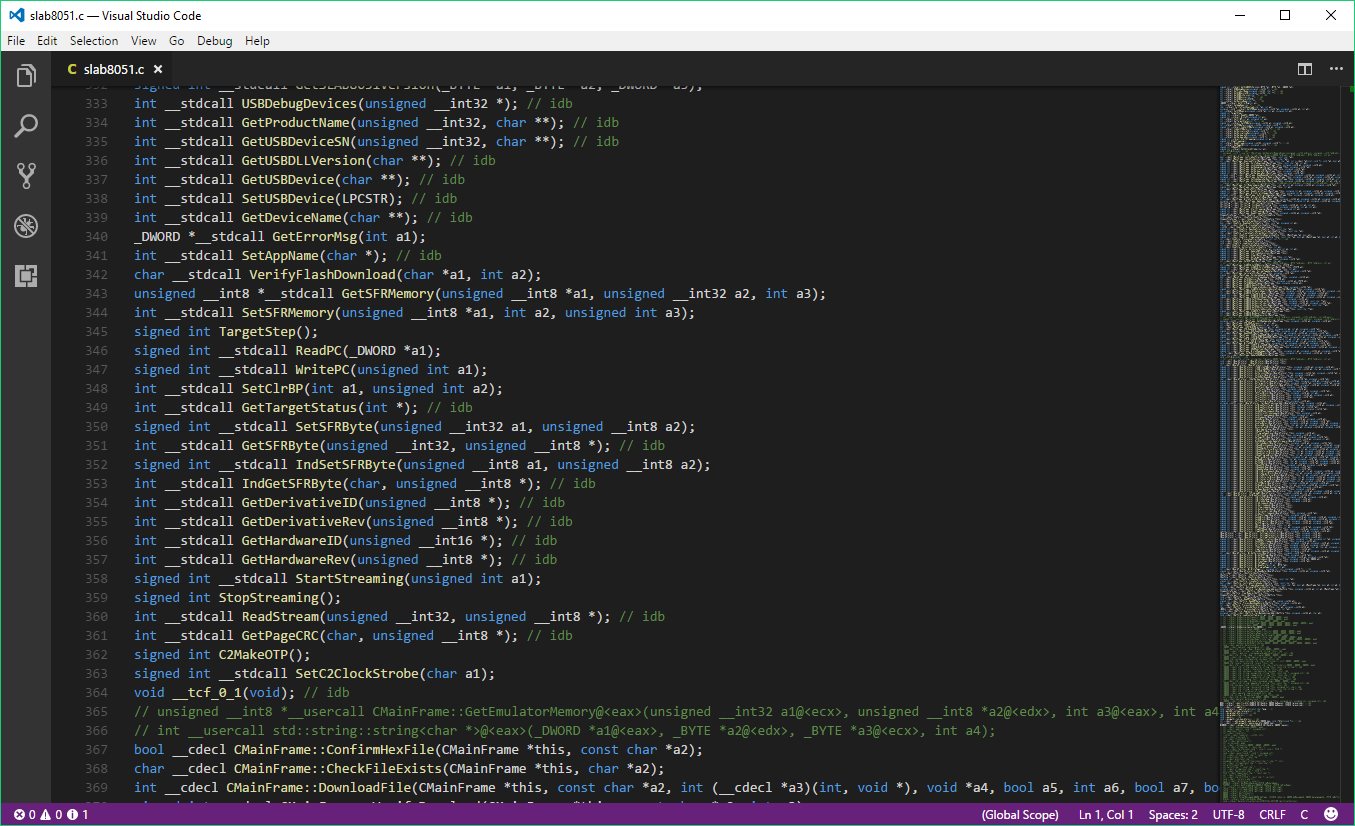
Instead, I stumbled upon the slab8051.dll interface that Simplicity Studio uses, and used IDA to decompile it to understand how the DLL is called into. By using the same DLL that Simplicity Studio uses, my application plays nicely with any running instances of Simplicity Studio (though obviously, you can’t use the app while there’s a debug session underway, as only one program can connect to the debugger at a time).
Caveats
Polling rate. Right now, the polling delay is hard-coded to 20 ms. Since the target has to be halted whenever the flag is polled, you want to ensure the MCU has plenty of time to do what it needs to do (suggesting a slow polling rate). At the same time, the longer this delay is, the longer it takes when the MCU does want to send a message to the host. A more efficient method would be to use some sort of multi-message buffer, so that the MCU wouldn’t have to be polled as often.
Intrusive connection. The MCU will be restarted whenever the debugger first connects; sorry, this is how the Silicon Labs API works — there’s no way to attach to a running target.
Interrupts Interrupted. Memory can’t be read or written to while the MCU core is running, so the software will halt the core before doing any reads/writes. This will certainly have implications with respect to interrupts/etc.
EFM8 Code
The code on the MCU side is extremely basic, and could be wrapped up into a macro. Here’s the example:
uint8_t xdata printData[255] _at_ 0x000; /* array at xdata 0x000 */

int main (void)
{
  int i, size;
  enter_DefaultMode_from_RESET();

  while (1)
  {
    i = 0;
    while(1) {
      size = sprintf(printData, "Hello, world #%u!\n", i++); // print "Hello, world #0 (etc)
      printData[254] = size; // tell the computer how many bytes to transfer
      while(printData[254] != 0); // wait for the computer software to reset our flag
    }
  }
}

WPF App
I wrote a quick WPF app that demonstrates this functionality, while exposing a few configuration parameters (buffer length, and start address). The source code for the app (along with example firmware) is available on GitHub, along with binaries.
Future Work
Interestingly, while looking through the decompiled DLL, I discovered that it’s actually the DLL’s job — not the debugger itself — to halt the target before reading/writing memory. I’m planning on modifying the DLL to see what happens if I try to read/write data on the MCU without halting it first.
I haven’t investigated debuggers for other 8-bit MCUs like the PIC, AVR, or STM8, but if they have a publicly-available API that allows you to read and write to memory, I’d imagine you’d be able to do the same thing. I have an AVRDragon, PICKit, and ST-Link debugger laying around — I hope I can find some down time to experiment on these other architectures.
This hack is less useful on ARM, since many ARM MCUs have SWO — but there’s definitely still some advantages when dealing with low pin-count devices (since SWO requires a separate pin). Also, I don’t believe SWO is available on the Cortex-M0 MCUs, so I suspect there’s some space there for a mechanism like this.
Try it out and leave a comment!
[…] Carlson] has a method by which he can piggyback these trace messages over an on-chip debugger. Though the newer ARM Cortex-M software debugger already has this facility but [Jay […]